Interpreting The Test Results
- Interpretation of the results of bowl perimetry
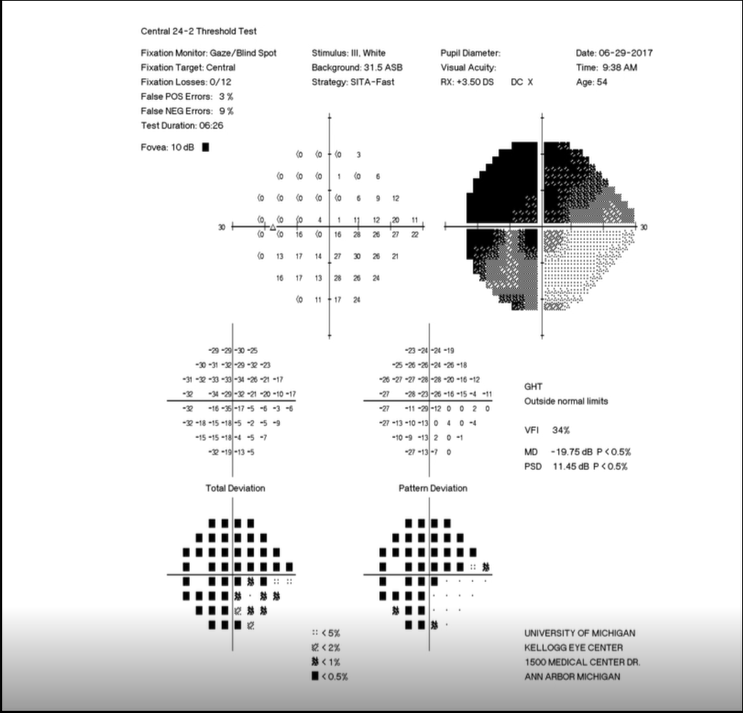
- Step 1: look at the Gray Scale Plot to get an overview of defects
- Step 2: look at the Mean Deviation, which gives an overview of the patient’s performance
-
Step 3:
look at the Reliability Indices,
which indicate if the patient paid attention
- Fixation losses: how often the patient signaled awareness of the stimulus when it was projected into the physiologic blind spot, where it should not have been seen; must not exceed 15%
- False positive responses: how often the patient signaled awareness of the stimulus when the stimulus was not shown; must not exceed 15%
- False negative responses: how often the patient failed to signal awareness of the stimulus when it was shown above a previously established luminance threshold; must not exceed 20%
-
Trap: the reliability indices do not disclose whether the patient deliberately and consistently performed poorly
- Step 4: look at the Raw Data Plot, which shows the visual field luminance thresholds at each test point; compare the luminance thresholds to those of age-matched normal subjects; look at the Total Deviation Plot to obtain a probability that a normal subject would have earned those thresholds
- Step 5: look at the Pattern Deviation Plot, which highlights focal defects by lifting clusters of high threshold points out of the background; focal defects always result from retinocortical visual pathway lesions